← Resources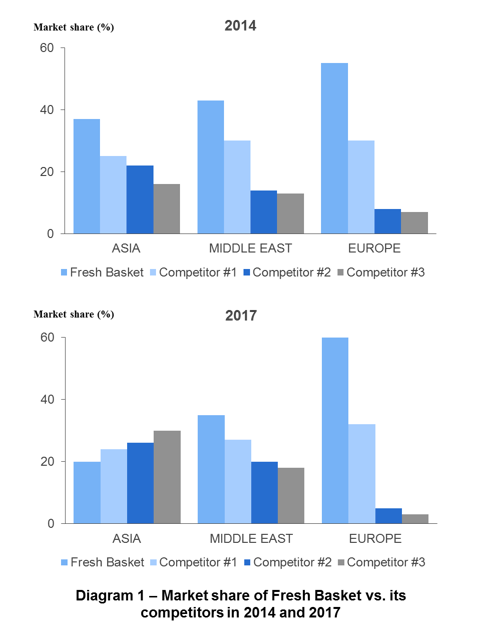
Fresh Basket
MidInterviewer-ledMarket analysisPricingProfitability
Case exhibits
3 exhibits for this case
Freshbasket-exhibit-1
1. Context
The interviewer needs to set up the case initially. Tell the interviewee that you will give a short context and then share the information given below.
Market Dynamics:
- The growth in wholesale food segment typically keeps pace with the GDP in most economies.
- This market also has high entry barriers as brand, distribution network and production require significant time and capital investment.
About the client:
- Fresh Basket has a varied range of products across the high end and the low end of the spectrum.
- Hotels and restaurants are its primary customers.
Competition Dynamics:
- The company primarily operates in three regions - Europe, Middle East and Asia.
- There is competition in each of these regions. In most cases the market is fragmented or at-least is a duopoly.
2. Market Analysis
After sharing the context, continue to lead the case and share Exhibit 1 with the candidate.
Share Exhibit 1 with the candidate.
Exhibit 1
Ask the candidate to identify the major factors that can be inferred from the Exhibit.
The following information can be inferred from Diagram 1:
- Fresh Basket's market share in the different markets
- Competitive dynamics in each of the regions
- Changes in market shares of the players from 2014 to 2017
Ask the candidate to identify 2-3 key points of specific information that can be gleaned from Exhibit 1.
The following information can be inferred from Diagram 1:
- The business seems to have significant economies of scale. This would explain the increase in market share in Europe, as well as the decrease in market share in Asia and Middle East.
- The drop in market share in Asia could possibly be because of the fact that Asia has several fast growing economies. The market is still evolving with a loss leadership strategy being played out by new entrants.
Key insight
- Freshbasket is the market leader in Europe and has consolidated its market share further from 2014 to 2017. It is likely that competition would be less intense in this region as the competitive dynamics have already been established. Freshbasket is likely to have a significant cost advantage over others due to economies of scale.
- The above information, if viewed with the lens of increasing profitability, would lead us to the conclusion that Freshbasket could potentially become a price leader in Europe and would be able to influence the prices in the region.
Prompt the candidate to reach the above inference if required. A great candidate might also at this point of time bring about the concept of gross margin and demand elasticity. He/she might recommend that the client needs to evaluate its product range and look at pricing strategy in different regions in order to improve profitability.
3. Pricing Strategy
After discussing all the issues from Exhibit 1, continue to lead the case and share Exhibit 2 with the candidate.
Share Exhibit 2 with the candidate.
Exhibit 2
Ask the candidate to identify what variable should be plotted on the X-axis.
The candidate must identify the X-axis to be demand elasticity. This graph shows the relationship between high prices (which in most cases would correspond to high gross margins) and demand elasticity (change in market demand).
Ask the candidate to illustrate the relationship between the two variables in Exhibit 2.
High gross margins would have a negative linear relationship with demand elasticity.
Low demand elasticity means that the consumers are unlikely to increase their purchases significantly if prices were to drop and vice versa. So if the company understands that the demand elasticity for a product is low, it makes sense to have gross margins. This signifies that if the product would have low demand elasticity, then gross margin would be high.
This can be illustrated with a downward sloping line from the top left corner of the graph.
Share Exhibit 3 with the candidate.
Exhibit 3
Ask the candidate to list out the inferences that s(he) can draw from Exhibit 3.
The candidate would need to keep in mind the downward sloping line that was discussed above and view the relationship in each quadrant.
The following information can be inferred from Diagram 3:
- The gross-margin vs demand elasticity relationship for Freshbasket's product lines does not follow the negative linear curve.
- The pricing strategy for the products in Quadrant I seems intuitive. Those products have low demand elasticity, therefore it makes sense that the gross margins for those products are high.
- Similarly, the pricing strategy for the products in Quadrant III also seems intuitive. Those products have a very high demand elasticity, it seems prudent to keep the gross margins low and to maximize sales.
- For the products in Quadrant II, although the demand elasticity is high, the margins have still been kept high. If the company were to reduce prices, there would be a significant increase in sales and the total profits would increase.
- For the products in Quadrant IV, the margins have been kept low, even though the demand elasticity is low. If the company were to increase margins and increase prices, it is unlikely to change sales and the total profits would increase.
4. Conclusion
Ask the candidate to succinctly summarize the case and the key recommendations for the client.
The candidate must cover the following key points in the conclusion:
- The pricing strategy would be different for different regions keeping in mind the competitive dynamics. In Europe, for example, the company could act as the price leader as it has significant market share.
- The pricing strategy for the products in Quadrant I and Quadrant III should be continued.
- The prices for the products in Quadrant II should be reduced in order to increase sales.
- The prices for the products in Quadrant IV should be increased in order to increase profit margins.